3. Jmeter command line execution and remote test


(adsbygoogle = window.adsbygoogle || []).push({});

*** Hope you have knowledge of running jmeter test from GUI ***

Running JMeter from command prompt:

1. Open command line prompt from jmeter/bin or Change path to where the ‘.jmx’ file is saved

2. Type command “jmeter –n –t <jmx file.jmx> -l <jtl file.jtl>” and press Enter

3. Wait till the test finishes ELSE for stopping test in between press ‘ctrl+c’ and Press ‘Y’ to stop else ‘N’ to continue.(Interrupted test results may not be correct.)

4. Find the ‘.jtl’ file to be generated at same path where the ‘.jmx’ file is located.

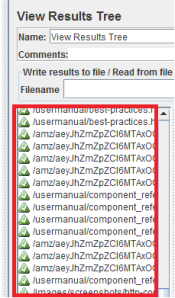
To know the results of test run from command line
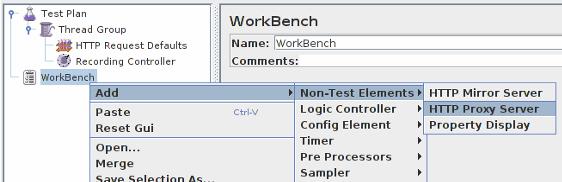
1. Open JMeter UI

2. Click on the Work bench and add a listener to it

point2

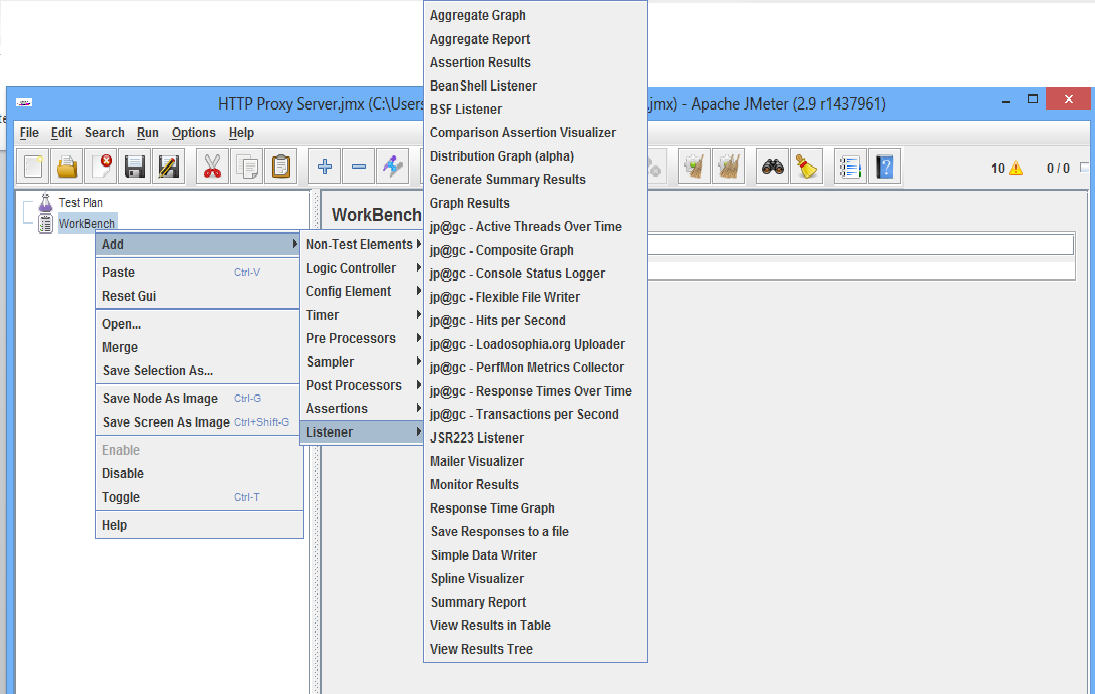
3. Add a listener as needed and which can upload a file to Jmeter UI

4. Upload the ‘.jtl’ file respective listener to see the results.

Running JMeter on Remote:

Before starting with remote testing, we need to check following Very IMP points:

1. The firewalls on the systems are turned off.

2. All the clients are on the same sub-net.

3. The server is in the same sub-net, if 192.x.x.x or 10.x.x.x ip addresses are used. If the server doesn’t use 192 or 10 ip address, there shouldn’t be any problems.

4. Make sure JMeter can access the server.

4.1 Turn on Sharing from “My computer> Properties> Advance System settings> Remote> Remote Assistance” AND

4.2 Turn on Sharing settings from “Control Panel> Network and Internet> Network and Sharing Center> Advanced sharing settings”

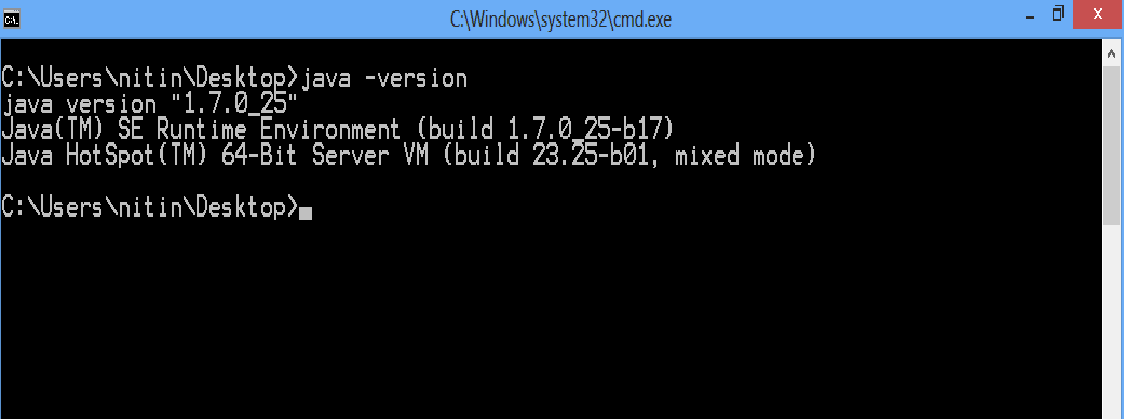
5. Make sure you use the same version of JMeter on all the systems. Mixing versions may not work correctly.

6. Make sure you have changed option to Computer sleeps from “Control Panel>Hardware and Sound>Power Options>Edit Plan Settings” for all machines (Master and Slave/s) to Never

To confirm the communication in channel: try to Ping from Slaves to Master and Master to Slaves, once.

Some terminologies need to understand:

Master – The system running Jmeter GUI, which controls the test

Slave – The system running jmeter-server, which takes commands from the GUI and send requests to the target system(s)

Target – The web-server we plan to stress test

Some important settings before we proceed to Remote test:

1. Go to Jmeter bin folder

2. Open “jmeter.properties” file in Edit mode

3. Go to “# Remote hosts and RMI configuration” section

4. Mention the IP address/es of Slaves as a value for “remote_hosts” and make sure you have uncommented the same.
e.g: remote_hosts=10.1.1.144,10.1.1.35,10.1.1.56,10.1.1.34,10.1.1.140

Note:Make sure you update this line in each run for the slaves included in the test with correct IP

Mention “server.rmi.create=false” for Master AND “server.rmi.create=true” for Slave/s
Uncomment “mode=Asynch”
Uncomment “asynch.batch.queue.size=” and update the value to 250
e.g.: asynch.batch.queue.size=250

(This setting denotes that, if your machine IP is used as SLAVE; it will serve 250 users max to run on.)

NOTE: Say you want to run a test on 5 remote slaves with 1000 of users; your Number of Threads (users) in Thread Group will be 200. (200*5 = 1000 users)

Please visit: http://www.ubik-ingenierie.com/blog/jmeter_performance_tuning_tips/

Running JMeter on Remote from CMD:

Please go through http://jmeter.apache.org/usermanual/remote-test.html to understand how to run jmeter on remote.

Lets run .jmx file remote from command line:

PART 1

NOTE: Make sure you have started the remote servers before running test.

1. Open command line form jmeter/bin

2. Enter following command:

jmeter -n -t myjmetertest.jmx -l myjmetertest_10users.jtl -R ipnumber1,ipnumber2

3. And the rest steps remain same as mentioned in Part 1

PART 2

For descriptive reports:
http://jmeter-plugins.org/wiki/LoadosophiaUploader/utm_source=jpgc&utm_medium=link&utm_campaign=LoadosophiaUploader

1. Open command line from jmeter/bin

2. Enter following command:

jmeter -n -t myjmetertest.jmx -l myjmetertest_10users.jtl.gz -R ipnumber1

3. And the rest steps remain same as mentioned in Part 1 above

part2Point3

You can find the .gz log file in the folder you mentioned to store in while configuring Loadsophia.

You can upload the .gz file to Loadsophia for reports.

Running JMeter on Remote from UI:(NOT recommended for big tests)

NOTE: Make sure you have started the remote servers before running test.

1. Open jmeter GUI

2. Open jmx file you would like to run on remote and add necessary listeners to Test Plan.

3. Click on “Remote Start all” button from top.

Enjoy the Jmeter ride!

My Sincere thanks to:

http://jmeter.apache.org/usermanual for maintaining a very good documentation.

Http://www.openmentor.net for making jmeter understanding start very easy.

And Emili H Halili for a vital book on Apache jmeter.

Suggestions and inputs are always welcomed!

**Don’t hesitate to Share the blog to increase Jmeter user base.**

I won’t mind if you mention credits to this blog while using contents from 🙂

*******

Few Tuning Tips for better results on Remote test.

Problems & Solutions


(adsbygoogle = window.adsbygoogle || []).push({});

2. Jmeter GUI – Record and playback


(adsbygoogle = window.adsbygoogle || []).push({});

***Hope you have referred “1. Setting up jmeter environment” to start with this step***

Setting up Apache JMeter proxy – With steps

This tutorial attempts to explain the exact steps for JMeter’s proxy. For those new to JMeter, one easy way to create a test plan is to use the Proxy. What the proxy does is it records the requests sent to the server.

Basic Proxy Instructions

1. Click on Batch file created on Desktop to start JMeter with GUI (you can also open jmeterw.cmd on Windows and jmeter on Linux/Unix OR jmeter.bat)

2. Select “Test Plan” on the tree

3. Right click on the “Test Plan” and add a new thread group: Add > Threads (Users) > Thread Group

create thread grp

Understanding Thread group elements:

  • Number of Threads  — the number of threads created. Each thread represents a single user. Therefore, if you want to simulate a load test with 10 concurrent users, enter 10 as the value for this property.
  • Ramp-Up Period  — the number of seconds JMeter will take to accelerate to create all of the threads needed. If the number of threads used is 10 and the ramp-up period is 20 seconds, JMeter will take 20 seconds to create those 10 threads, creating one new thread every two seconds. If you want all threads to be created at once, put 0 in this box.
  • Forever  — if clicked, this option tells JMeter to keep sending requests to the tested application indefinitely. If disabled, JMeter will repeat the test for the number of times entered in the Loop Count box.
  • Loop Count  –this property value only has an effect if the Forever check box is unchecked. It tells JMeter the number of times it has to repeat the test.

By default, the thread group is configured to loop once through its elements.

4. Select the Thread Group

5. Right click “Add > Config Element > HTTP Request Defaults”

6. In new HTTP Request Defaults element: Server name – enter “jmeter.apache.org”

7. Path – leave blank

8. Right click on the “Thread Group” and add a recording controller: Add > Logic Controller > Recording Controller

point8

9. Select WorkBench

10. Right click on WorkBench and add the Http proxy: Add > Non-Test Elements > HTTP Proxy Server

point10_proxyServer

11. On HTTP Proxy Server, click the “Add” button in “URL Patterns to Include”. This will create a blank entry. (Optional)

12. Enter “.*\.html” (Optional)

13. Click 3 times, the “Add” button in “URL Patterns to Exclude”. This will create 3 blank entries. (Optional)

14. Enter “.*\.png” pattern, “.*\.gif” pattern and “.*\.ico” pattern (Optional)

point14

15. Right click on “HTTP Proxy Server” and add a listener: Add > Listener > View Results Tree

point15_resultTree

16. Return to HTTP Proxy Server, and click the “Start” button at the bottom.

Configure your browser to use the JMeter HTTP Proxy

At this point, JMeter’s proxy is running. For this exercise, we will use Firefox to

view some pages on JMeter.

17. Start Firefox, but do not close JMeter.

18. From the tool bar, click “Edit > Preferences” (or “Tools > Preferences”). This should bring up the options.

19. Select the “Advanced” tab, and “Network” tab

20. Click on “Settings” button near the bottom

point16_startingProxyServer

21. On the new pop-up, check “Manual proxy configuration”. The address and port fields should be enabled now.

22. Address – enter “local-host” or the IP address of your system

23. For port – enter “8080”.

24. Check “Use this proxy server for all protocols”

Point20_proxy

25. Click “OK” button on Connection Settings pop up.

26. Click “OK” button on Options pop up. This should return you to the browser.

Lets record the navigation now

27. With your browser, in the “Address” bar at the top, enter http://jmeter.apache.org/index.html” and hit the “enter” key.

28. Click on a few links on JMeter’s pages.

29. Close your browser and bring up the JMeter window.

point25

Expand the thread group and there should be several samplers. At this point, the test plan can be saved as is. If you forget to add default http request settings, you will have to manually delete the server name, and port.

In this sample, there aren’t any default request parameters. If a particular request parameter is required by all pages, the request defaults is where one would add the entries.

30. Select “Thread Group”

31. Right click “Add > Listener > Summary Report” to add an summary listener.

point27

31.1 Similarly, add “View Results Tree” from listeners to thread group.

32. The summary listener will show some basic statistics.

point28

33. Select “Thread Group”

34. Number of Threads – enter 5

35. Ramp up Period – do not change

36. Loop Count – enter 100

point32

Start the test

At this point, we are ready to run our test plan and see what happens. Save the test plan.

Before you RUN the test, select “View results tree”. This  will show you each Sampler status in terms of Pass – Green or Fail – Red.

When you’re ready to run the test, there’s two ways:

a. Run -> Start

b. Ctrl–R

This is recommended to test if the script passes in test run or not.

After running the test, you will be able to know about each sampler as follows:

startTest_viewResultTree

As the test runs, the statistics will change in “Summary report” until the test is done. At the end of the test, the summary report should look like as follows:

Runtest_SummaryReport

While the test is running, in the upper right-hand corner, there should be a green square.

When the test is done, the box should be grey (after green).

testRunComplete

Following is a description for Summary report contents

Label – The label of the sample. If “Include group name in label?” is selected, then the name of the thread group is added as a prefix. This allows identical labels from different thread groups to be collated separately if required.

  • # Samples – The number of samples with the same label
  • Average – The average elapsed time of a set of results
  • Min – The lowest elapsed time for the samples with the same label
  • Max – The longest elapsed time for the samples with the same label
  • Std. Dev. – the  Standard Deviation  of the sample elapsed time
  • Error % – Percent of requests with errors
  • Throughput – the  Throughput  is measured in requests per second/minute/hour. The time unit is chosen so that the displayed rate is at least 1.0. When the throughput is saved to a CSV file, it is expressed in requests/second, i.e. 30.0 requests/minute is saved as 0.5.
  • Kb/sec – The throughput measured in Kilobytes per second
  • Avg. Bytes – average size of the sample response in bytes. (in JMeter 2.2 it wrongly showed the value in kb)

Times are in milliseconds.

Please visit http://jmeter.apache.org/usermanual/best-practices.html to know for Best Practices to be followed in JMeter.

And http://jmeterresults.blogspot.in/2012/07/jmeterunderstanding-summary-report.html for understanding meaning for each column in summary report.

And the interesting step: Jmeter command line execution and remote test


(adsbygoogle = window.adsbygoogle || []).push({});

1. Setting up jmeter environment


(adsbygoogle = window.adsbygoogle || []).push({});

On the first step itself, let me tell you the fact that JMETER is easy to learn. It’s AWESOME!

So, here we go!!!

Pre-requisites for JMeter:

Download latest JDK from http://jdk8.java.net/download.html and install on the machine as per machine configuration.

Also mention the java JDK bin path under ‘PATH’ of ‘System variables’ of environment variables.

To verify if the java is successfully installed on machine:

  1. Open CMD prompt from root directory where the java is installed.
  2. Type ‘java -version’ and press Enter.

 jmeter_cmline_java_confirm

Setting up JMeter environment:

Part 1:

  1. Go to Jmeter Bin folder
  2. Open “jmeter.bat” file in Edit mode
  3. Go to “:doneStart”
  4. Replace the values for ‘set’ with mentioned as follows:

set HEAP=-Xms1024m -Xmx3072m

set NEW=-XX:NewSize=512m -XX:MaxNewSize=2042m

set SURVIVOR=-XX:SurvivorRatio=8 -XX:TargetSurvivorRatio=50%

set TENURING=-XX:MaxTenuringThreshold=2

set RMIGC=-Dsun.rmi.dgc.client.gcInterval=600000 -Dsun.rmi.dgc.server.gcInterval=600000

set PERM=-XX:PermSize=64m -XX:MaxPermSize=64m

Part 2:

Update java runtime space.

  1. Go to Control Panel
  2. Click on PROGRAMS
  3. Click on JAVA (A Popup will open)
  4. Click on Java tab of the popup
  5. Click on View button (Make sure you are on User tab after redirecting)
  6. Add “Xmx3072m” under ‘Runtime parameters’ column
  7. Click on each OK while exiting one by one.

Part 3:

Update Environment variables with Jmeter

  1. Copy Jmeter bin path
  2. Go to Environment Variables
  3. Go to System variables > Path
  4. Click on Edit
  5. Paste the Jmeter bin path
  6. Click on Save

Part 4:

Including server ip and domain name in system host file.

  1. Include the server ip with its domain name in the Host file in Master as well as all Slave machines.
  2. Only the server to hit should be UNCOMMENTED in the file
  3. Save the file.

Part 5:

Creating a Batch file on Desktop:

1. Open a new text file

2. Paste the following code in:

@ ECHO off

ECHO.

<Path of ApacheJmeter jar file in bin folder>

e.g.: C:\apache-jmeter-2.9\bin\ApacheJMeter.jar

3. Save file as “.bat” extension on Desktop

4. Double click on the batch file created, to confirm jmeter GUI is opening.

And you are DONE with basic configuration! 

Next simple step is Jmeter GUI – Record and playback

Some additional tuning tips for Jmeter property file


(adsbygoogle = window.adsbygoogle || []).push({});